intro-to-reticulate
Python in R Markdown
To use Python in R Markdown, we need to load the
{reticulate} R package in a
code chunk, we do it here in the setup code chunk. We also load the
{ggplot2} R package so we can plot
some data from a Python pandas data frame later on!
Python in .Rmd files
Load libraries
Just like R, you can use Python in .Rmd files! Here we import the
Python package that we need to import our data into Python, pandas.
pandas is a Python package that adds data reading, wrangling, and
simple data visualization functionality to Python. It holds a similar
place as the {tidyverse} R meta-package does (however pandas is not a
meta-package, just a very large package). If you want to learn more
about pandas, see the “10 minutes to
pandas”
in the docs our checkout this free interactive course:
https://prog-learn.mds.ubc.ca/en.
import pandas as pd
Load data
Let’s load the titanic data (which lives in the data directory of this
project) and view the data:
titanic = pd.read_csv("data/titanic.csv")
plot data
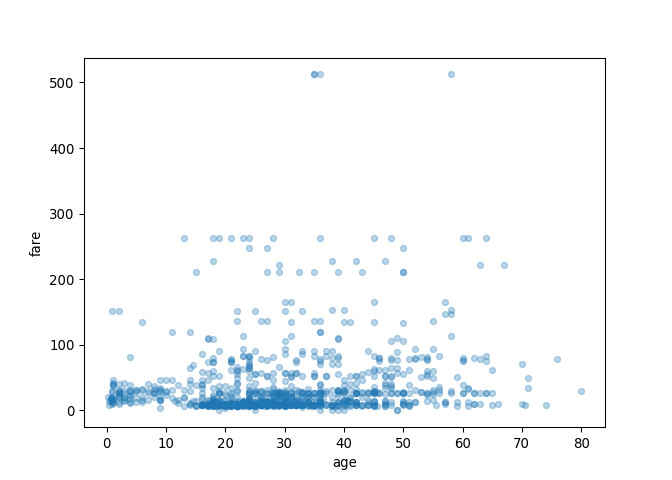
Using Python and pandas
First, let’s use some quick and simple pandas plotting functions:
titanic.plot.scatter(x='age', y='fare', alpha=0.3)
Want to learn more about getting started plotting in Python using
pandas, see this page to get started:
https://pandas.pydata.org/pandas-docs/stable/user_guide/visualization.html
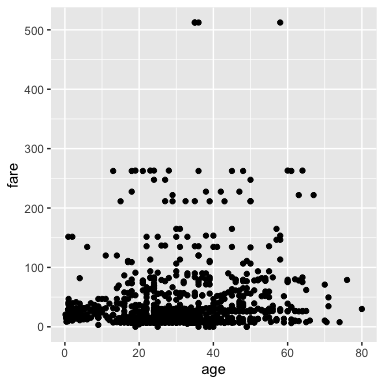
Using R and {ggplot2}
We can also access the Python environment in this R Markdown document
from R! This allows us to apply R’s functions on our Python objects! We
can use the py$obbject syntax to do this and create a data
visualization using {ggplot2}!
ggplot2::ggplot(py$titanic, aes(x = age, y = fare)) +
  geom_point()
Subsetting data in pandas
Here we subset the age and fare columns:
titanic[["age", "fare"]]
##           age      fare
## 0     29.0000  211.3375
## 1      0.9167  151.5500
## 2      2.0000  151.5500
## 3     30.0000  151.5500
## 4     25.0000  151.5500
## ...       ...       ...
## 1304  14.5000   14.4542
## 1305      NaN   14.4542
## 1306  26.5000    7.2250
## 1307  27.0000    7.2250
## 1308  29.0000    7.8750
##
## [1309 rows x 2 columns]
Here we filter for rows containing people over 85:
titanic[titanic["age"] > 70]
##       pclass  survived  ...   body                home.dest
## 9          1         0  ...   22.0      Montevideo, Uruguay
## 14         1         1  ...    NaN            Hessle, Yorks
## 61         1         1  ...    NaN  Little Onn Hall, Staffs
## 135        1         0  ...    NaN             New York, NY
## 727        3         0  ...  171.0                      NaN
## 1235       3         0  ...    NaN                      NaN
##
## [6 rows x 14 columns]
Here we find the destination of the first passenger:
first_dest = titanic["home.dest"][0]
And inline python code within markdown text!
The destination of the first passenger is St Louis, MO.